Quick answer
To read blood test results, go line by line and check the number against the reference range printed next to it on your own report, not a range from the internet. An H means above the range, an L below it. Most reference ranges cover the middle 95% of healthy people, so 1 in 20 healthy people lands outside any single range, and on a 20-test report the chance of at least one flag in a perfectly healthy person is about 64%. Look for results far outside the range, several related results moving together, or a trend across tests before you worry.
The parts of a result line
Every lab formats reports a little differently, but Labcorp, Quest and at-home services all print the same six pieces of information for each test.
| Column | Example | What to do with it |
|---|---|---|
| Test name | ALT (SGPT) | Look up abbreviations in our blood test abbreviations list |
| Result | 38 | The measured or calculated value |
| Flag | H | Outside the lab range; blank means inside it |
| Units | U/L | Always check before comparing with another lab or article |
| Reference range | 0 to 32 | The lab's own range for your sex and age; this is the one that counts |
| Notes | Calculated; fasting: no | Tells you if a value was estimated, or if the sample had a problem |
Some values are not measured at all but calculated from others. LDL cholesterol on most panels, eGFR, globulin, the A/G ratio and every ratio (BUN to creatinine, TG to HDL) are arithmetic on other results, so an error in one measured value carries into them.
What the flags mean
| Flag | Meaning | What to do |
|---|---|---|
| H or L | Above or below the reference range | Check how far out, and whether related markers agree |
| HH, LL, C or "critical" | Far enough out that the lab treats it as urgent | Labs usually phone the ordering clinician; call your doctor the same day |
| A or * | Abnormal, used for results without a numeric range (for example "positive") | Read the comment line |
| QNS | Quantity not sufficient: not enough sample | The test needs to be redone |
| Hemolyzed | Red cells burst in the tube | Potassium, AST and LDH can read falsely high; repeat |
| Calc or calculated | Worked out from other results | Accuracy depends on the inputs |
A flag only tells you the value sits outside the lab's range. It says nothing about how much that matters. An ALT of 34 U/L flagged H against a range of 0 to 32 is very different from an ALT of 400 U/L.
Reference ranges and the 5% rule
A reference range is built by testing a large group of healthy people and keeping the middle 95% of their results. By definition, 2.5% of healthy people fall above it and 2.5% below. MedlinePlus puts it plainly: it is common for healthy people to sometimes have results outside the reference range, and a result inside the range is not a guarantee of good health.
The more tests on a report, the more likely a harmless flag becomes. If the tests were independent, the odds work out like this:
Our arithmetic: 1 minus 0.95 to the power of the number of tests, assuming each range covers the middle 95% of healthy people (Testing.com) and results are independent. Real markers are partly linked, so treat these as rough.
Ranges also differ between labs because methods and reference groups differ. For ALT, MedlinePlus lists 4 to 36 U/L and Cleveland Clinic lists 0 to 45 U/L. That is why MedlinePlus says you cannot compare results from different labs against each other's ranges, and why trend tracking works best at one lab. More on liver ranges in our liver function test guide.
Units and conversions
US labs mostly report in conventional units (mg/dL); most other countries use SI units (mmol/L, µmol/L). The same result looks very different in each, so check the unit before you compare a number with anything. Our lab unit converter does these for you.
| Marker | US unit | SI unit | To convert US to SI |
|---|---|---|---|
| Glucose | mg/dL | mmol/L | divide by 18 |
| Cholesterol (total, LDL, HDL) | mg/dL | mmol/L | multiply by 0.0259 |
| Triglycerides | mg/dL | mmol/L | multiply by 0.0113 |
| Creatinine | mg/dL | µmol/L | multiply by 88.4 |
| Vitamin D (25-OH) | ng/mL | nmol/L | multiply by 2.5 |
| Testosterone | ng/dL | nmol/L | multiply by 0.0347 |
| HbA1c | % | mmol/mol | (% minus 2.15) times 10.93 |
| Lp(a) | mg/dL | nmol/L | no reliable fixed factor; retest in the same unit |
Optimal vs normal: the debate
"Normal" means typical of the lab's reference group. "Optimal" means the level linked with the best long-term outcomes, and the two can differ a lot, because the reference group includes people who are healthy today but on the way to disease.
- Guideline cut-offs that sit inside lab ranges. A fasting glucose of 100 to 125 mg/dL and an HbA1c of 5.7% to 6.4% are the prediabetes ranges in the American Diabetes Association's 2026 Standards, even where a lab range does not flag them.
- Tighter ranges from specialists. The American College of Gastroenterology puts a truly healthy ALT at 29 to 33 U/L for men and 19 to 25 U/L for women, below many lab upper limits.
- Lab ranges stricter than guidelines. Many labs flag vitamin D under 30 ng/mL, while the NIH Office of Dietary Supplements says 20 ng/mL is adequate for bone health in nearly everyone.
- Treatment goals instead of ranges. Cholesterol has goals, not a normal range: the 2026 ACC/AHA guideline sets LDL goals of under 100, 70 or 55 mg/dL depending on risk.
Be wary of "optimal ranges" invented by wellness companies without a cited guideline or study behind them. A good rule: use the lab range to spot errors and outliers, and published guideline cut-offs to judge risk.
Trends beat single values
Your body chemistry shifts with sleep, meals, hydration, exercise, illness and time of day, so any single value has noise in it. A trend is harder to fool. Three habits make trends meaningful:
- Same lab, same method. MedlinePlus recommends one lab for tracking because methods differ.
- Same conditions. Same time of day, same fasting state, no hard workout the day before, not while ill.
- Repeat before acting. The ADA confirms a diabetes diagnosis with a second abnormal result unless symptoms are clear, and the AUA asks for two separate morning testosterone results before diagnosing low testosterone.
Example: a ferritin of 80, then 45, then 22 ng/mL over 18 months is "normal" each time on a 15 to 150 range, but the trend points to falling iron stores well before any flag appears.
A fully annotated sample report
Below is a made-up report for a 48-year-old woman, formatted the way large US labs print results. Ranges are illustrative; always use the ones on your own report.
| Test | Result | Flag | Units | Range | How to read it |
|---|---|---|---|---|---|
| Glucose, fasting | 102 | H | mg/dL | 70 to 99 | In the 100 to 125 prediabetes range (ADA). One value needs confirming, ideally with HbA1c |
| HbA1c | 5.6 | % | 4.8 to 5.6 | Top of normal; 5.7% starts the prediabetes range. Together with the glucose, worth retesting in a year or sooner | |
| Creatinine | 0.92 | mg/dL | 0.57 to 1.00 | Normal; feeds the eGFR calculation | |
| eGFR | 76 | mL/min/1.73 m² | 59 or more | KDIGO stage G2 range, which is not kidney disease unless there is other damage such as albumin in urine | |
| ALT | 38 | H | U/L | 0 to 32 | Mild, under 2 times the upper limit. Common causes: fatty liver, alcohol, some medicines, hard exercise. Recheck |
| AST | 29 | U/L | 0 to 40 | Normal; AST below ALT fits a fatty liver pattern more than alcohol | |
| Total cholesterol | 228 | H | mg/dL | 100 to 199 | Borderline high (200 to 239) |
| HDL | 62 | mg/dL | 39 or more | 60 or higher is considered protective | |
| Triglycerides | 95 | mg/dL | 0 to 149 | Normal | |
| LDL, calculated | 147 | H | mg/dL | 0 to 99 | Friedewald: 228 minus 62 minus 95/5 = 147. Borderline high (130 to 159) |
| TSH | 2.1 | µIU/mL | 0.45 to 4.5 | Normal | |
| Ferritin | 18 | ng/mL | 15 to 150 | Inside the range but near the bottom; with fatigue or heavy periods, ask about iron studies | |
| Hemoglobin | 12.1 | g/dL | 11.1 to 15.9 | Normal | |
| Vitamin D, 25-OH | 24 | L | ng/mL | 30 to 100 | Flagged by the lab, but above the 20 ng/mL NIH adequacy line; a flag that depends on whose cut-off you use |
How a careful reader sums this up: three flags matter (glucose, LDL, ALT), one flag is a definition question (vitamin D), and one unflagged value deserves a question (ferritin). The glucose, ALT and lipids often travel together with insulin resistance, which is a reason to look at the triglyceride to HDL ratio (1.5 here, which is low) and to retest all three in 3 to 6 months after any change. Take a report like this to your doctor rather than acting on it alone.
Patterns worth knowing
| Pattern on the report | What it often points to | Read more |
|---|---|---|
| High ALT and AST, ALT higher | Liver cell stress, often fatty liver | Liver function test |
| High ALP and GGT together | Bile duct (cholestatic) pattern | Liver patterns |
| High BUN with normal creatinine | Dehydration or a high-protein diet more often than kidney disease | Kidney function test |
| Low hemoglobin with low MCV | Small red cells, classic for iron deficiency | CBC blood test |
| High triglycerides with low HDL | Insulin resistance | Lipid panel |
| Several CMP values slightly off at once | Sample handling or hydration | CMP blood test |
What to test next
| If you want to | Test | Good option |
|---|---|---|
| Confirm one borderline flag | The same test, same lab, same conditions | Ask your doctor to repeat it |
| Check glucose, electrolytes and a full CBC with platelets | CMP and CBC with differential | Labcorp OnDemand, $49 and $29 at a lab |
| Track blood sugar without fasting | HbA1c every 3 to 6 months | SiPhox Longevity Essentials or Heart & Metabolic |
| See heart risk beyond LDL | ApoB and Lp(a) | SiPhox Longevity Essentials (both included) |
| Watch liver and kidney trends at home | ALT, AST, ALP, bilirubin, creatinine, eGFR, BUN | SiPhox Heart & Metabolic |
| Get the broadest picture once a year | 62 markers incl. iron, B12, GGT, thyroid, hormones | SiPhox Ultimate 360 |
Not sure how accurate home kits are? Read are at-home blood tests accurate first.
Longevity Essentials
The default panel: heart, metabolic, hormone and inflammation markers in one draw.
Check price
Heart & Metabolic
Lipids plus kidney and liver function: the panel for cardiovascular and metabolic risk.
Check price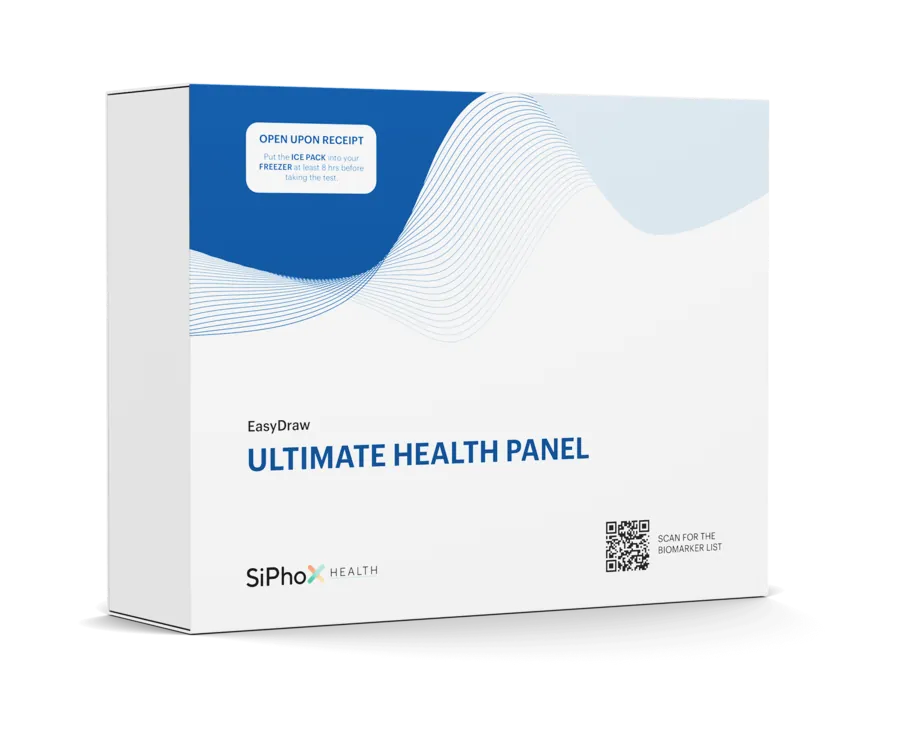
Ultimate 360
Everything on the four core panels plus iron studies, B12 and folate, GGT and PSA.
Check price
Frequently asked questions
What do H and L mean on a blood test?
H means the result is above the lab's reference range and L means below it. It shows where the number sits against healthy people tested by that lab, not how serious it is. Look at how far out it is and whether related markers agree.
Is it normal to have some abnormal blood test results?
Yes. Reference ranges cover the middle 95% of healthy people, so about 1 in 20 healthy people falls outside any single range. On a 20-test report the chance of at least one flag is roughly 64%.
Why are my reference ranges different from another lab?
Labs use different methods, machines and reference groups, so their ranges differ. For ALT, MedlinePlus lists 4 to 36 U/L and Cleveland Clinic 0 to 45 U/L. Always read a result against the range printed on the same report.
Should I worry about a slightly high result?
Usually not on its own. A value just outside the range, with normal related markers and no symptoms, is often repeated rather than acted on. Results far outside the range or flagged as critical need a call to your doctor.
Can I compare results from different labs?
Only roughly. Units, methods and ranges differ, so MedlinePlus advises using the same lab when you track trends. If you must compare, convert units first and compare each result with its own lab's range.
Sources
- MedlinePlus: How to understand your lab results
- Testing.com: Laboratory test reference ranges (why 5% of healthy people fall outside)
- American Diabetes Association. 2. Diagnosis and classification of diabetes: Standards of Care in Diabetes 2026
- MedlinePlus: Hemoglobin A1C (HbA1c) test
- Kwo PY et al. ACG clinical guideline: evaluation of abnormal liver chemistries. Am J Gastroenterol 2017
- NIH Office of Dietary Supplements: Vitamin D fact sheet for health professionals
- American Heart Association newsroom: ACC/AHA issue updated guideline for managing lipids, cholesterol (March 13, 2026)
- American Urological Association: Testosterone deficiency guideline
- MedlinePlus Medical Encyclopedia: Comprehensive metabolic panel, normal values
- Cleveland Clinic: Liver function tests, normal ranges
- KDIGO 2024 clinical practice guideline for the evaluation and management of chronic kidney disease
- MedlinePlus: Cholesterol levels
- SiPhox Health: membership, panels and pricing (checked 29 Sep 2026)