The triglyceride to HDL ratio is your fasting triglycerides divided by your HDL cholesterol, both from the same standard lipid panel. With both values in mg/dL, a ratio of 3.0 or more identified insulin-resistant overweight adults in a 2003 Stanford study, and a young-adult study found risk factors worsened above 2.5 in women and 3.5 in men. Enter your numbers below; the calculator accepts mg/dL or mmol/L.
What is a good triglyceride to HDL ratio?
| Band | Ratio (mg/dL) | Ratio (mmol/L) | Basis |
|---|---|---|---|
| Low | Under 2.5 | Under 1.1 | Below the lowest published insulin-resistance cut-off (2.5, young women, Murguia-Romero 2013) |
| Borderline | 2.5 to 2.9 | 1.1 to 1.2 | Above the young-women cut-off, below the adult cut-off |
| High | 3.0 or more | 1.3 or more | At or above the McLaughlin 2003 cut-off for insulin resistance |
These bands are our summary of two studies, not an official guideline: no US guideline sets a target for this ratio. Men in the 2013 study only showed worse risk factors above 3.5, so a man at 3.2 sits nearer the edge than a woman at 3.2. Use the ratio as a flag that prompts a closer look, not as a diagnosis. For the parts on their own, see our triglycerides and HDL cholesterol pages.
Both values in mg/dL. Sources: Murguia-Romero 2013 (2,244 students); McLaughlin 2003 (258 overweight adults).
Worked example: a ratio of 4.5
Say a 42-year-old man gets a fasting lipid panel back with triglycerides of 180 mg/dL and HDL of 40 mg/dL. His ratio is 180 / 40 = 4.5. That is above the 3.0 adult cut-off and above the 3.5 line for young men, so it lands in the high band.
The NCEP ATP III guideline classes fasting triglycerides of 150 to 199 mg/dL as borderline high and calls HDL under 40 mg/dL low, so he sits at the edge of both. Before reading much into it, check three things: was he fasting, did he drink alcohol the evening before, and is he on a medicine that raises triglycerides (see the list below).
Questions worth taking to his doctor: should this be repeated fasting on the same lab? Does a ratio this high justify an HbA1c and a fasting insulin for HOMA-IR? Does his ApoB change how his LDL should be read? If he cut back on alcohol and refined carbohydrates and his next panel showed triglycerides of 130 and HDL of 43, the ratio would fall to 3.0: better, but still at the cut-off.
mg/dL vs mmol/L: why the numbers look different
US labs report cholesterol and triglycerides in mg/dL; most other countries use mmol/L. The two tests use different conversion factors (divide triglycerides by 88.57 and HDL by 38.67 to get mmol/L), so the ratio itself changes with the units:
ratio in mmol/L = ratio in mg/dL divided by 2.29
| Example | Triglycerides | HDL | Ratio |
|---|---|---|---|
| US report | 150 mg/dL | 50 mg/dL | 3.0 |
| Same person, mmol/L report | 1.69 mmol/L | 1.29 mmol/L | 1.3 |
| US report | 90 mg/dL | 60 mg/dL | 1.5 |
| Same person, mmol/L report | 1.02 mmol/L | 1.55 mmol/L | 0.66 |
A ratio of 2 on a UK or Canadian report is therefore high (about 4.6 in US units), while 2 on a US report is fine. The McLaughlin paper printed its cut-off as "1.8 in SI units", but converting 3.0 with the standard factors gives 1.3, which is the value we use. The calculator above converts automatically when you pick mmol/L.
Why the ratio matters
Insulin resistance changes blood fats in a recognizable way: the liver releases more triglyceride-rich particles and HDL falls. The ratio captures both moves in one number, which is why it works as a cheap stand-in when fasting insulin is not measured.
- Insulin resistance. In 258 overweight adults, a ratio of 3.0 or more identified insulin resistance with 64% sensitivity and 68% specificity, similar to the metabolic syndrome criteria (McLaughlin 2003). The authors suggested it as the most practical marker when no standardized insulin test is available.
- Heart attack risk. In a Boston case-control study, people in the highest quarter of the ratio had about 16 times the heart attack risk of those in the lowest quarter (Gaziano 1997), a stronger link than triglycerides alone.
- Young adults. Among 2,244 healthy students, those above 3.5 (men) or 2.5 (women) had more adverse cardiometabolic risk factors, and about a third were insulin resistant (Murguia-Romero 2013).
For the full picture, pair the ratio with HbA1c, C-peptide or a HOMA-IR from fasting insulin and glucose.
Where the ratio falls short
- It works poorly in African American adults. An NIH study found neither triglycerides nor the ratio could separate insulin-resistant from insulin-sensitive African American adults; fasting insulin did much better (Sumner 2005).
- It needs a fasting sample. Triglycerides rise for hours after a meal, so a non-fasting ratio reads high.
- It does not count particles. For atherosclerosis risk, ApoB and LDL remain the main targets in guidelines.
- Very high triglycerides are a medical issue in their own right; talk to your doctor rather than tracking a ratio.
What moves the ratio
Triglycerides respond quickly, often within weeks, to less alcohol, fewer refined carbohydrates and sugary drinks, weight loss and regular exercise. HDL moves more slowly and tends to rise with exercise and weight loss. Because both parts shift, the ratio is a good number to retest a few months after a change. Medication decisions, such as statins or triglyceride-lowering drugs, belong with your doctor.
Common questions about the TG:HDL ratio
Does it matter if I ate before the test?
For the ratio, yes. A 2016 European Atherosclerosis Society consensus found triglycerides run on average about 26 mg/dL higher 1 to 6 hours after a normal meal, while HDL does not change with eating. With an HDL of 50 mg/dL, that meal alone adds about 0.5 to the ratio. The 2018 AHA/ACC guideline accepts a non-fasting lipid panel for routine risk checks and asks for a fasting repeat when non-fasting triglycerides are 400 mg/dL or more. The published ratio cut-offs came from fasting samples, so fast overnight when you want to compare with them.
Which medicines and conditions push it up?
Anything that raises triglycerides raises the ratio. The 2018 AHA/ACC guideline lists secondary causes worth ruling out before blaming diet: poorly controlled diabetes, an underactive thyroid (a TSH test checks it), chronic kidney disease, pregnancy, alcohol, and drugs including oral estrogen, glucocorticoids, retinoids, some beta blockers, thiazide diuretics, protease inhibitors and bile acid sequestrants. Ask your doctor before stopping any of them.
How fast does it change, and when should I retest?
Triglycerides move within weeks of a change in alcohol, carbohydrate intake or weight, while HDL moves more slowly. For drug treatment, the 2018 AHA/ACC guideline asks for a repeat lipid panel 4 to 12 weeks after starting or changing a statin, then every 3 to 12 months as needed. Allow a similar 3 months after a lifestyle change, and use the same lab and the same fasting state each time so the numbers are comparable.
What should I test alongside it?
For blood sugar, pair the ratio with HbA1c and C-peptide, or a fasting insulin and glucose for HOMA-IR. For heart risk, ApoB: a high ratio often goes with many small LDL particles, which ApoB counts and LDL cholesterol can miss. For the liver, ALT, since fatty liver commonly travels with insulin resistance.
Tracking the ratio at home
SiPhox Health reports triglycerides, HDL and the triglycerides:HDL ratio on five of its six EasyDraw panels: Longevity Essentials, Heart & Metabolic, Thyroid Focus, GLP Optimization and Ultimate 360. Collection is a needle-free device on the upper arm, and you can retest monthly, quarterly or every six months. SiPhox does not publish a fasting requirement for its kits, so for a clean ratio we would collect in the morning before eating. Our insulin resistance test guide explains what SiPhox does and does not measure.
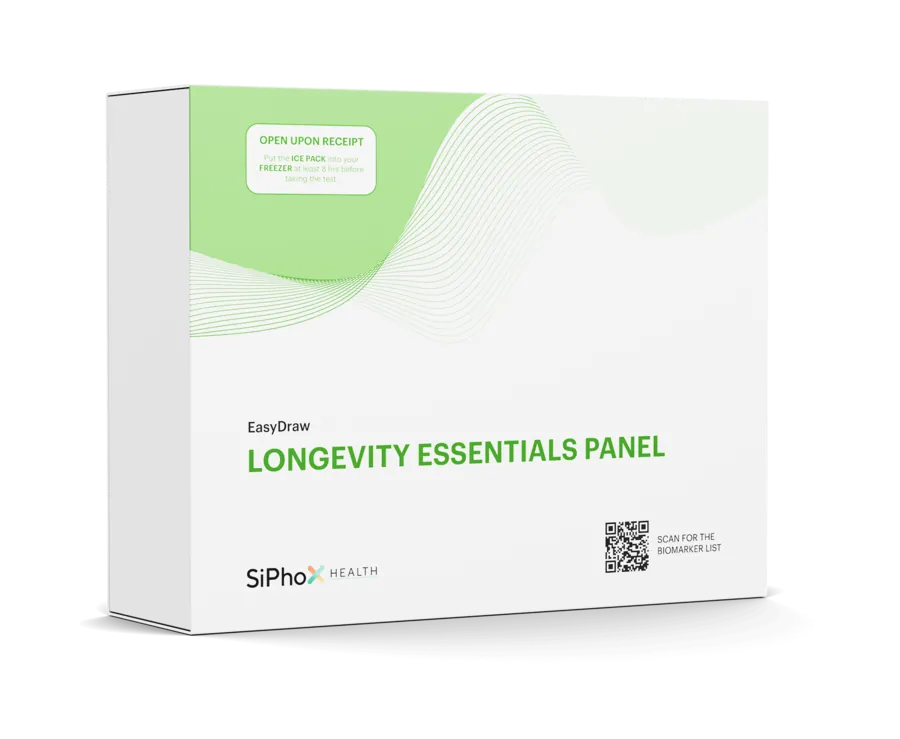
Longevity Essentials
The default panel: heart, metabolic, hormone and inflammation markers in one draw.
Check price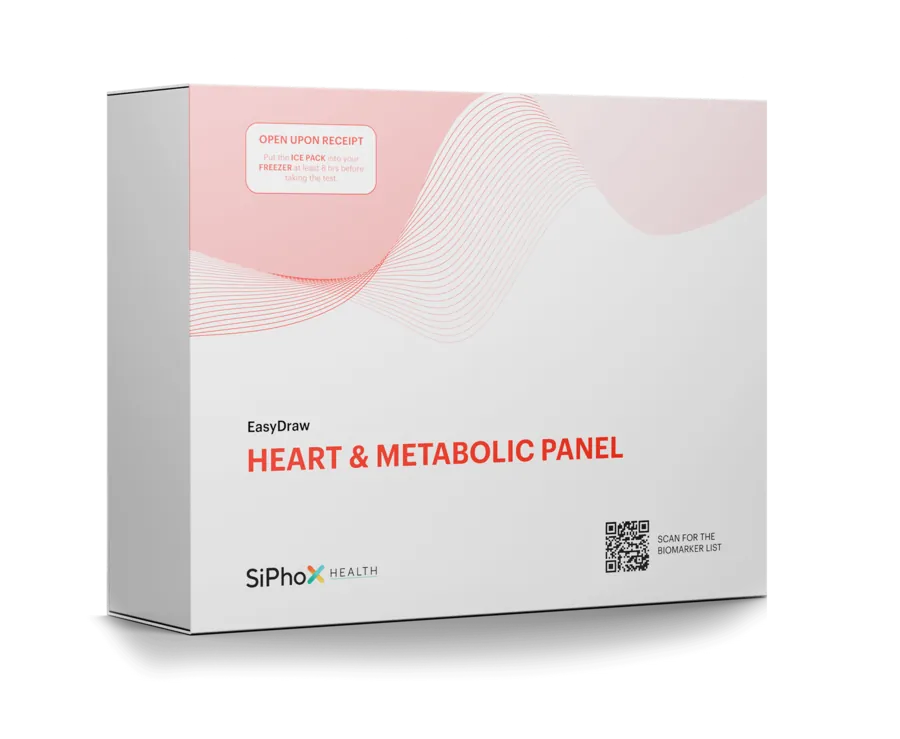
Heart & Metabolic
Lipids plus kidney and liver function: the panel for cardiovascular and metabolic risk.
Check price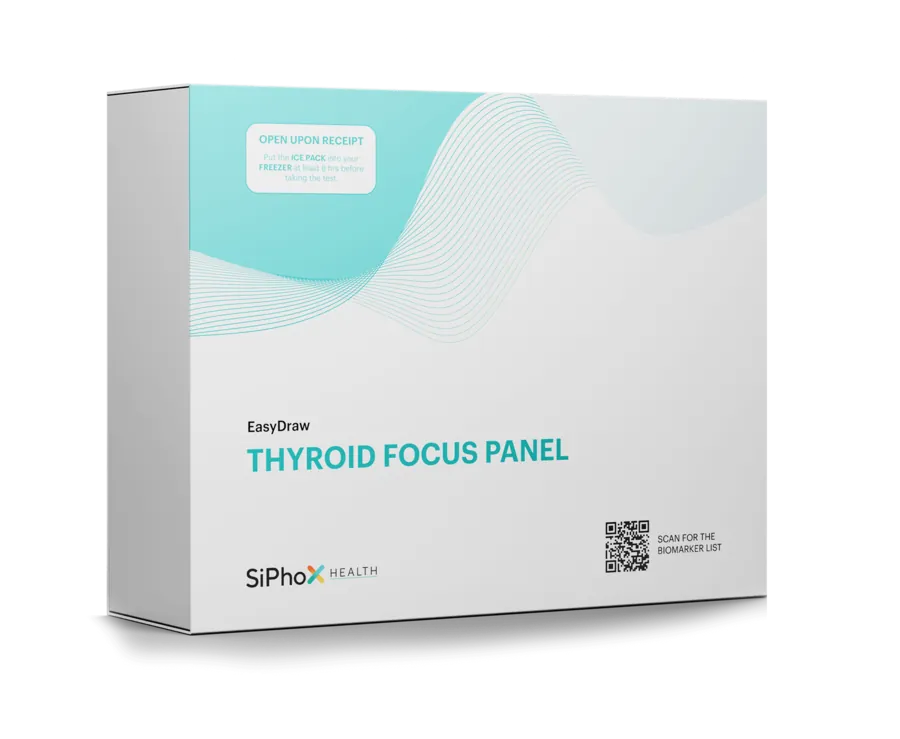
Thyroid Focus
A full thyroid workup including both thyroid antibodies, plus core lipids.
Check price
Frequently asked questions
What is a good triglyceride to HDL ratio?
With both values in mg/dL, under 2.5 is low and 3.0 or more suggests insulin resistance (McLaughlin 2003). In mmol/L, the same cut-offs are about 1.1 and 1.3.
How do you calculate the triglyceride to HDL ratio?
Divide fasting triglycerides by HDL cholesterol, both in the same units. For example, 150 mg/dL divided by 50 mg/dL gives 3.0.
Is the ratio the same in mmol/L?
No. The ratio in mmol/L is the mg/dL ratio divided by 2.29, so 3.0 in US units is about 1.3 in mmol/L. Always check which units your report uses.
What does a high triglyceride to HDL ratio mean?
It suggests insulin resistance and a less favorable lipid profile, and it was linked to a much higher heart attack risk in a 1997 study. It is a flag for further testing, such as fasting insulin, HbA1c and ApoB, not a diagnosis.
Does SiPhox measure the TG:HDL ratio?
Yes. It is reported on Longevity Essentials, Heart & Metabolic, Thyroid Focus, GLP Optimization and Ultimate 360.
Sources
- McLaughlin T et al. Use of metabolic markers to identify overweight individuals who are insulin resistant. Ann Intern Med 2003
- Murguia-Romero M et al. Plasma TG/HDL-C ratio, insulin resistance and cardiometabolic risk in young adults. J Lipid Res 2013
- Gaziano JM et al. Fasting triglycerides, HDL and risk of myocardial infarction. Circulation 1997
- Sumner AE et al. Triglyceride and the TG:HDL ratio are not markers of insulin resistance in African Americans. Arch Intern Med 2005
- 2018 AHA/ACC Guideline on the Management of Blood Cholesterol. Circulation 2019
- NHLBI: ATP III guidelines at-a-glance quick desk reference (NCEP)
- Nordestgaard BG et al. Fasting is not routinely required for determination of a lipid profile: EAS/EFLM consensus. Eur Heart J 2016
- SiPhox Health panel comparison (checked 29 Sep 2026)
- SiPhox Health: Longevity Essentials EasyDraw panel and price
- SiPhox Health: Heart & Metabolic EasyDraw panel