Quick answer
There is no single at home insulin resistance test. Doctors use a handful of blood markers that each show part of the picture: fasting insulin, HOMA-IR (fasting insulin times fasting glucose), the triglyceride to HDL ratio, HbA1c and C-peptide. A TG:HDL ratio of 3.0 or more (in mg/dL) picked out insulin-resistant overweight adults in a 2003 Stanford study, and an HbA1c of 5.7% to 6.4% is the prediabetes range.
To be clear about SiPhox Health: its current EasyDraw panels measure HbA1c, C-peptide and the TG:HDL ratio, but not fasting insulin or fasting glucose, so they cannot give you a true HOMA-IR. For that you still need a fasting draw at a lab.
The five markers and their cut-offs
| Marker | What it shows | Cut-off or range | Source |
|---|---|---|---|
| Fasting insulin | How hard the pancreas works to keep glucose normal | Lab range 2.6 to 24.9 uIU/mL; no agreed insulin-resistance cut-off | Labcorp |
| HOMA-IR | Insulin resistance estimated from fasting insulin and glucose | 1.0 is the model's healthy reference; published cut-offs run from about 1.9 to 3.8 | Matthews 1985; Gayoso-Diz 2013; Qu 2011 |
| TG:HDL ratio | A lipid pattern that tracks insulin resistance | 3.0 or more in mg/dL (about 1.3 in mmol/L) | McLaughlin 2003 |
| HbA1c | Average blood sugar over about 3 months | Under 5.7% normal, 5.7% to 6.4% prediabetes, 6.5% or more diabetes | MedlinePlus |
| C-peptide | Released in equal amounts to insulin, so it mirrors insulin output | Lab-specific; interpreted with glucose and fasting state | MedlinePlus |
Two points stand out. First, insulin resistance shows up years before HbA1c rises, because the pancreas compensates by making more insulin. That is why a normal HbA1c does not rule it out. Second, the TG:HDL ratio is cheap and easy but is not reliable in everyone: a 2005 NIH study found it did not identify insulin resistance in African American adults, where fasting insulin performed far better.
MedlinePlus HbA1c cut-offs. The outer ends (4 and 8) are drawn for scale only; insulin resistance can be present while HbA1c is still normal.
Worked example: calculating HOMA-IR and TG:HDL
HOMA-IR comes from the 1985 Matthews model: fasting insulin (uIU/mL) x fasting glucose (mg/dL) / 405, or fasting insulin x fasting glucose in mmol/L / 22.5. The TG:HDL ratio is triglycerides divided by HDL, both in the same unit.
Say Mark, 47, carries weight around his waist. A fasting lab draw gives insulin of 14 uIU/mL and glucose of 98 mg/dL. His HOMA-IR is 14 x 98 / 405 = 3.39, above the common 2.6 threshold and near the top of the 1.9 to 3.8 range of published cut-offs. A home panel the same month shows triglycerides of 165 mg/dL and HDL of 42 mg/dL, a TG:HDL ratio of 165 / 42 = 3.93, above the 3.0 line from the McLaughlin study. In mmol/L that is 1.86 / 1.09 = 1.71, above the 1.3 equivalent. His HbA1c is 5.6%, still in the normal band. Three markers point one way and HbA1c has not caught up yet, which is the textbook early pattern. That is a conversation for his doctor, and a reason to track the trend.
| Mark's marker | Result | Cut-off | Reading |
|---|---|---|---|
| HOMA-IR | 3.39 | 2.6 common threshold | Above |
| TG:HDL (mg/dL) | 3.93 | 3.0 | Above |
| HbA1c | 5.6% | 5.7% prediabetes | Normal, high end |
| Fasting glucose | 98 mg/dL | Labcorp fasting range to 99 mg/dL | Normal, high end |
If Mark then tracks at home, he gets HbA1c, C-peptide and TG:HDL every quarter from SiPhox Longevity Essentials: $124 + 3 x $149 = $571 in year one. A fasting insulin and glucose repeat through his doctor once a year gives him a fresh HOMA-IR to set against that trend. Try your own numbers in our TG:HDL ratio calculator.
What SiPhox measures and what it does not
| Marker | Longevity Essentials | Heart & Metabolic | GLP Optimization | Ultimate 360 |
|---|---|---|---|---|
| HbA1c | Yes | Yes | Yes | Yes |
| C-peptide | Yes | Yes | Yes | Yes |
| TG:HDL ratio | Yes | Yes | Yes | Yes |
| Fasting insulin | No | No | No | No |
| Fasting glucose | No | No | No | No |
| HOMA-IR | No | No | No | No |
Older SiPhox finger-prick panels listed fasting insulin and HOMA-IR, which is why some older reviews still mention them; the current EasyDraw panels do not. Leaving glucose off is defensible: a 2025 study of a similar upper-arm collection device found glucose was one of only two tests that fell outside accuracy limits, because glucose keeps being used up in a sample on its way to the lab. C-peptide is the closest SiPhox gets to an insulin reading, and MedlinePlus notes it enters the blood at the same time and in equal amounts to insulin. SiPhox does not publish a fasting protocol for it, so interpret it as a trend rather than against a fasting cut-off. The one-off SiPhox Kidney, Liver and Lp(a) kit does list glucose, but not insulin, so it still cannot produce a HOMA-IR.
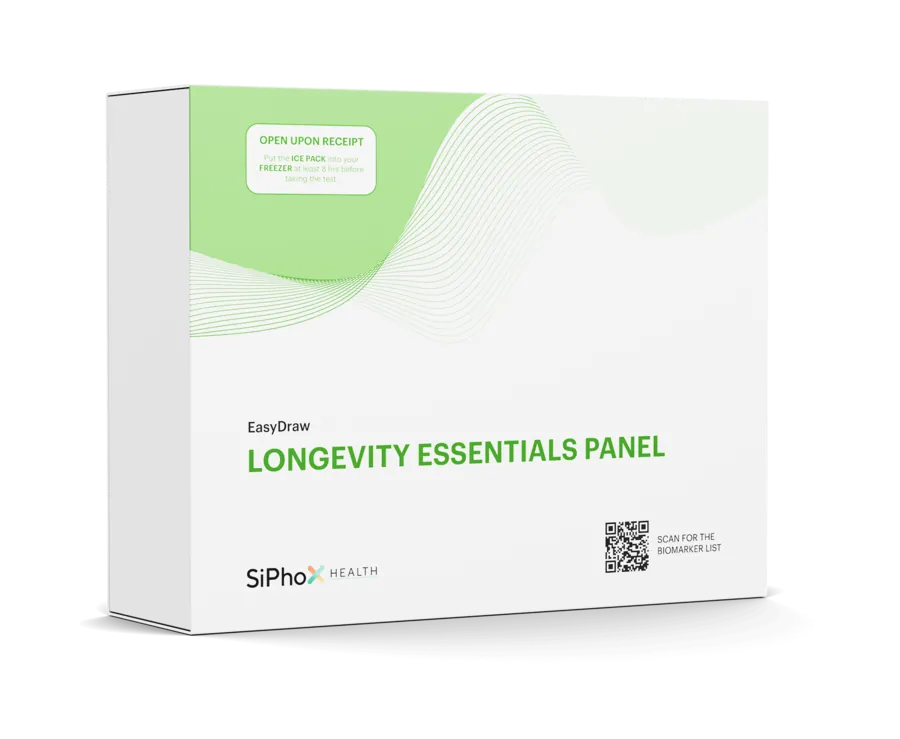
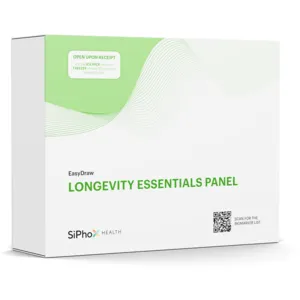
Longevity Essentials
The default panel: heart, metabolic, hormone and inflammation markers in one draw.
Check price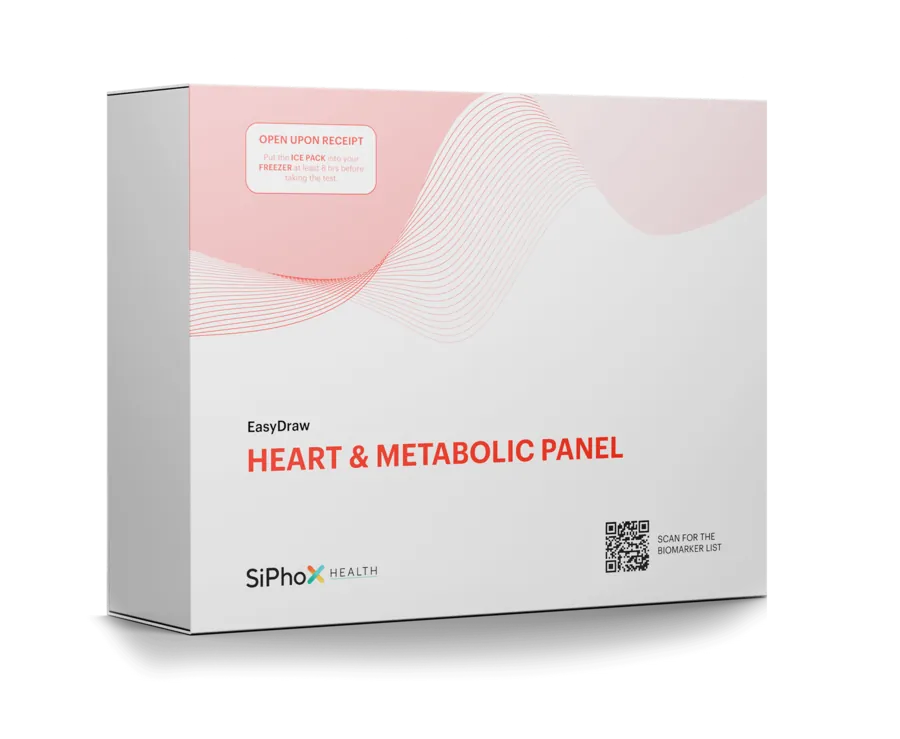
Heart & Metabolic
Lipids plus kidney and liver function: the panel for cardiovascular and metabolic risk.
Check price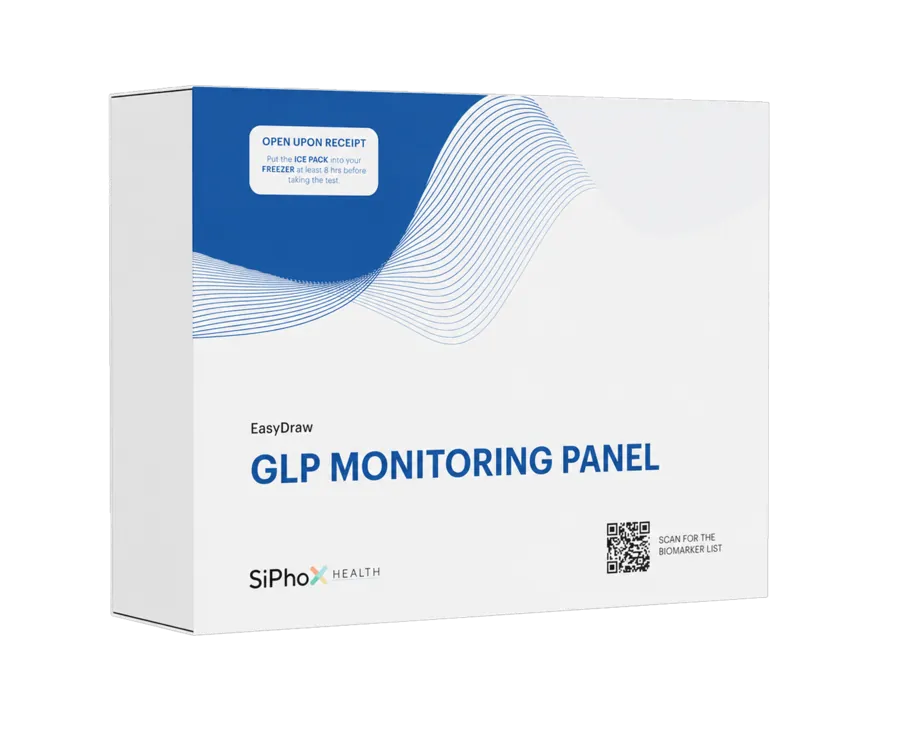
GLP Optimization
Built for people on GLP-1 medication: metabolic, liver, kidney, nutrient and iron markers.
Check priceYour testing options compared
| Route | What you get | Needle? | Best for |
|---|---|---|---|
| Lab fasting insulin + glucose (via doctor or a direct-to-consumer lab) | True HOMA-IR | Yes, venous | A one-off, accurate insulin-resistance number |
| SiPhox Longevity or Heart & Metabolic ($124 + $25) | HbA1c, C-peptide, TG:HDL, plus lipids and ApoB | No | Tracking metabolic trends every 1 to 6 months at home |
| SiPhox GLP Optimization ($199 + $25) | The same three markers plus liver, kidney and nutrients | No | People on GLP-1 medication |
| Finger-prick HbA1c kit | HbA1c only | Finger prick | A cheap blood sugar check |
If you want the HOMA-IR number itself, do one fasting lab draw and plug the results into our HOMA-IR calculator. If you want to watch whether diet, exercise or medication is moving your metabolism, a home panel you can repeat is more practical. Our at-home A1c test guide compares the finger-prick kits.
Our arithmetic from SiPhox prices checked 29 Sep 2026, including $25 US shipping per test. Longevity includes the $124 first test; the other rows use list price for every test ($149 and $224).
How fast each marker moves
How often to retest depends on how quickly each number can change. Testing HbA1c every month mostly measures the same red blood cells twice; testing triglycerides the morning after a big dinner measures the dinner.
| Marker | What window it reflects | Sensible retest gap | Keep constant |
|---|---|---|---|
| HbA1c | Average blood sugar over about 3 months (MedlinePlus) | About every 3 months | Same lab and method |
| Triglycerides and TG:HDL | Recent diet and alcohol; can shift within weeks | Every 1 to 3 months while changing habits | Fasting state, no alcohol the night before |
| C-peptide | Insulin output around the time of the sample | With each panel, read as a trend | Time of day and whether you have eaten |
| Fasting insulin and HOMA-IR | The fasting state that morning | Once or twice a year at a lab | 8 or more hours fasting, morning draw |
A quarterly SiPhox cadence lines up with HbA1c's three-month window, which is why it suits metabolic tracking. Whatever you choose, collect at the same time of day and in the same fed or fasted state each time; a change in method can look like a change in you. If a result lands in the prediabetes range, our prediabetes blood test guide covers what doctors check next.
Which route to choose
| If you want | Best route | Why |
|---|---|---|
| A true HOMA-IR number | Fasting insulin and glucose at a lab | The only way to get both fasting values from one venous sample |
| To confirm or rule out prediabetes | Your doctor | Diagnosis needs lab confirmation, often a repeat HbA1c or fasting glucose |
| A cheap one-off HbA1c | Finger-prick A1c kit | HbA1c only; no lipids or C-peptide |
| To track HbA1c, C-peptide and TG:HDL every quarter, no needle | SiPhox Longevity Essentials | $149 a test ($124 first) with ApoB, Lp(a) and hs-CRP |
| The same plus kidney and liver (fatty liver shows in ALT) | SiPhox Heart & Metabolic | $149 a test, 28 markers |
| Metabolic tracking on GLP-1 medication | SiPhox GLP Optimization | $224 a test, adds liver, kidney, B12, folate and iron |
The most complete low-effort plan combines the two: one fasting lab draw a year for HOMA-IR, and a home panel every quarter for the markers that move between lab visits. With SiPhox Longevity Essentials that is $571 in year one for the home side, plus whatever your lab or insurance charges for the fasting draw.
Reading the markers together
No single number settles it. A pattern is more convincing than one value:
- Likely insulin resistant: TG:HDL ratio of 3 or more, high-normal HbA1c (5.5% to 5.6%) or prediabetes range, and a high C-peptide for your lab.
- Reassuring: TG:HDL under 2, HbA1c under 5.4%, triglycerides under 100 mg/dL.
- Mixed: worth a fasting insulin and glucose test through your doctor to get a HOMA-IR.
Retest on the same lab and under the same conditions each time, ideally in the morning before eating, so that changes reflect you rather than the sample. Waist size, blood pressure and family history add to the picture. Triglycerides respond fastest to changes in diet and alcohol, often within weeks, while HbA1c takes about three months to reflect a change. A result in the prediabetes range should go to your doctor, who can confirm it and discuss treatment.
Frequently asked questions
Is there an at-home test for insulin resistance?
Partly. Home kits can measure HbA1c, C-peptide and the triglyceride to HDL ratio, which all track insulin resistance. The standard HOMA-IR needs fasting insulin and glucose, which SiPhox's current EasyDraw panels do not measure.
Does SiPhox test fasting insulin?
No. SiPhox's current EasyDraw panels measure HbA1c, C-peptide and the TG:HDL ratio, not fasting insulin or glucose. Some older finger-prick SiPhox panels listed fasting insulin and HOMA-IR.
What TG:HDL ratio means insulin resistance?
A ratio of 3.0 or more, with both values in mg/dL, identified insulin-resistant overweight adults in McLaughlin et al. 2003. In mmol/L the same cut-off is about 1.3. It works poorly in African American adults.
Can HbA1c show insulin resistance?
Only late. HbA1c reflects average blood sugar, which stays normal for years while the pancreas makes extra insulin. A normal HbA1c does not rule out insulin resistance.
What is a normal HOMA-IR?
The model defines 1.0 as the value of a healthy young adult. Published cut-offs for insulin resistance range from about 1.9 to 3.8 depending on the population, and 2.6 is a common clinical threshold.
Sources
- McLaughlin T et al. Use of metabolic markers to identify overweight individuals who are insulin resistant. Ann Intern Med 2003
- Sumner AE et al. Triglyceride and the TG:HDL ratio are not markers of insulin resistance in African Americans. Arch Intern Med 2005
- Matthews DR et al. Homeostasis model assessment. Diabetologia 1985
- Gayoso-Diz P et al. HOMA-IR cut-off values and the metabolic syndrome (EPIRCE). BMC Endocr Disord 2013
- Qu HQ et al. The definition of insulin resistance using HOMA-IR. PLoS One 2011
- Labcorp test 004333: Insulin (reference range)
- MedlinePlus: Insulin in blood
- MedlinePlus: C-peptide test
- MedlinePlus: Hemoglobin A1C (HbA1c) test
- Diagnostics (Basel) 2025: performance of an upper-arm capillary blood collection device
- SiPhox Health panel comparison (checked 29 Sep 2026)
- SiPhox Health: Longevity Essentials EasyDraw panel and price
- SiPhox Health: GLP Optimization panel
- SiPhox Health: Kidney, Liver and Lp(a) Panel