HOMA-IR (homeostatic model assessment of insulin resistance) turns one fasting glucose and one fasting insulin result into an estimate of how resistant your body is to insulin. The model was built so that a healthy young adult scores 1.0. Published cut-offs for insulin resistance run from about 1.9 to 3.8 depending on the population, and 2.6 is a commonly used clinical threshold. Enter your fasting results below in mg/dL or mmol/L.
HOMA-IR normal range
| HOMA-IR | Our band | Where the number comes from |
|---|---|---|
| About 1.0 | Low | The model's reference value for healthy young adults (Matthews 1985) |
| Under 2.0 | Low | Below the cardiometabolic cut-offs of 1.85 (men) and 2.05 (all adults) in a 2,459-person study (Gayoso-Diz 2013) |
| 2.0 to 2.5 | Borderline | Above those cut-offs, below the common clinical threshold |
| 2.6 or more | Likely insulin resistant | The popular clinical cut-off of 2.60 cited by Qu 2011 |
| 3.5 or more | High | Above the 90th percentile in the general adult population (3.46, Gayoso-Diz 2013) |
These bands are our synthesis of the studies named, not a guideline: no US body has set an official HOMA-IR range. One study of Mexican American adults put the best cut-off at 3.80, which shows how much the threshold depends on who is being measured. Use the number to prompt a conversation with your doctor, alongside HbA1c, waist size and blood pressure.
Sources: Gayoso-Diz 2013 (2,459 adults in Spain); Qu 2011.
How HOMA-IR is calculated
The formula comes from the original 1985 Oxford paper by Matthews and colleagues:
- US units: fasting glucose (mg/dL) x fasting insulin (uIU/mL) / 405
- SI units: fasting glucose (mmol/L) x fasting insulin (uIU/mL) / 22.5
| Fasting glucose | Fasting insulin | HOMA-IR |
|---|---|---|
| 90 mg/dL (5.0 mmol/L) | 5 uIU/mL | 1.1 |
| 90 mg/dL | 9 uIU/mL | 2.0 |
| 95 mg/dL | 12 uIU/mL | 2.8 |
| 90 mg/dL | 24.9 uIU/mL (top of the lab range) | 5.5 |
If your insulin is reported in pmol/L, divide by 6 (some labs use 6.95) to get uIU/mL first. Both samples must be fasting and taken at the same time: Labcorp follows the American Diabetes Association definition of at least 8 hours with no calories. The calculator uses the same formula and handles the unit switch for glucose.
Fasting insulin normal range
Labcorp's reference range for fasting insulin is 2.6 to 24.9 uIU/mL, and its fasting glucose range is 70 to 99 mg/dL. The last row of the table above shows the problem with the insulin range: someone at the top of it with a perfectly normal glucose already has a HOMA-IR of about 5.5. A "normal" insulin flag does not mean you are insulin sensitive.
That gap is the whole point of the test. Early insulin resistance keeps glucose and HbA1c normal because the pancreas pumps out more insulin to compensate, so fasting insulin climbs years before blood sugar does. MedlinePlus notes that insulin results are read alongside a glucose test for exactly this reason. High fasting insulin itself rarely causes symptoms; people more often notice weight gain around the waist, or have a high triglyceride to HDL ratio on a routine panel.
Our arithmetic: glucose x insulin / 405, using Labcorp's fasting insulin range of 2.6 to 24.9 uIU/mL at three points in its 70 to 99 mg/dL glucose range.
Worked example: normal flags, high HOMA-IR
Say a 50-year-old woman has a fasting glucose of 97 mg/dL, a fasting insulin of 14 uIU/mL and an HbA1c of 5.6%. Every result sits inside its lab range: glucose is under 100, insulin is well under 24.9, and MedlinePlus puts prediabetes at an HbA1c of 5.7% to 6.4%. Her HOMA-IR is 97 x 14 / 405 = 3.4.
That is above the 2.6 clinical threshold and close to the 3.46 that marked the top 10% of adults in the Spanish study. Read it as a sign her pancreas may be working harder to hold glucose normal, not as a diagnosis. First confirm both samples were truly fasting and drawn together, then look at her TG:HDL ratio and waist size for the same pattern.
Questions for her doctor: is this worth repeating on the same lab in 3 months? Would an oral glucose tolerance test add anything with an HbA1c of 5.6%? Do my triglycerides, ALT and blood pressure fit insulin resistance? Tracking is simple arithmetic: if her insulin fell to 9 uIU/mL at the same glucose, HOMA-IR would drop to 2.2.
Why there is no single cut-off
- Insulin assays are not standardized. The same blood can give different insulin values on different lab platforms, so a HOMA-IR from one lab is not directly comparable with another. The model's authors stress that the input data need to be robust and interpreted carefully (Wallace 2004).
- Populations differ. Cut-offs from Spanish, Mexican American and other cohorts range from under 2 to almost 4.
- Age and sex matter. The 2013 Spanish study found the useful threshold changed with age in women, and was lower in men.
- It is an estimate. The gold standard, a clamp study, is a research procedure. HOMA-IR is a practical approximation that works best for tracking the same person on the same lab.
Common questions about HOMA-IR
Can I use HOMA-IR if I take insulin or diabetes medicine?
Not with a standard insulin result if you inject insulin, because the test cannot separate your own insulin from the injected kind. MedlinePlus notes that C-peptide can make that distinction, and the model's authors describe running HOMA on fasting C-peptide instead of insulin (Wallace 2004). Metformin, GLP-1 medicines and other drugs that change insulin sensitivity also change the result, so note what you take when you compare numbers over time.
Why does another calculator give me a different number?
The 1985 formula is an approximation. The Oxford group also released a computer version, HOMA2, which Wallace 2004 describes as available but less widely used, and it gives somewhat different values from the same inputs. Every cut-off on this page applies to the original formula, which is what our calculator uses. Check which version a report or study used before comparing.
How often should I retest, and what goes with it?
A borderline value is best confirmed with a second fasting draw on the same lab, because insulin assays differ between platforms. After a change in diet, weight, activity or medication, 3 months is a practical gap: it matches HbA1c, which reflects roughly the past 3 months of blood sugar (MedlinePlus), so both can be read together. Useful companions are the TG:HDL ratio, C-peptide, ALT for fatty liver, and ApoB for heart risk.
Getting tested, and what SiPhox covers
To get a HOMA-IR you need a fasting insulin and fasting glucose from the same venous draw, ordered through your doctor or a direct-to-consumer lab. Then use the calculator above.
To be direct: SiPhox Health's current EasyDraw panels do not measure fasting insulin or glucose, so they cannot give you a HOMA-IR. What they do measure are the closest related markers: HbA1c, C-peptide (made in equal amounts to insulin) and the triglyceride to HDL ratio, on Longevity Essentials, Heart & Metabolic, GLP Optimization and Ultimate 360. SiPhox's one-off Kidney, Liver and Lp(a) kit lists glucose, but not insulin. A sensible approach is one fasting lab test for your HOMA-IR baseline, then an at-home panel to track the related markers as you change diet, exercise or medication. Our insulin resistance test guide compares the routes.

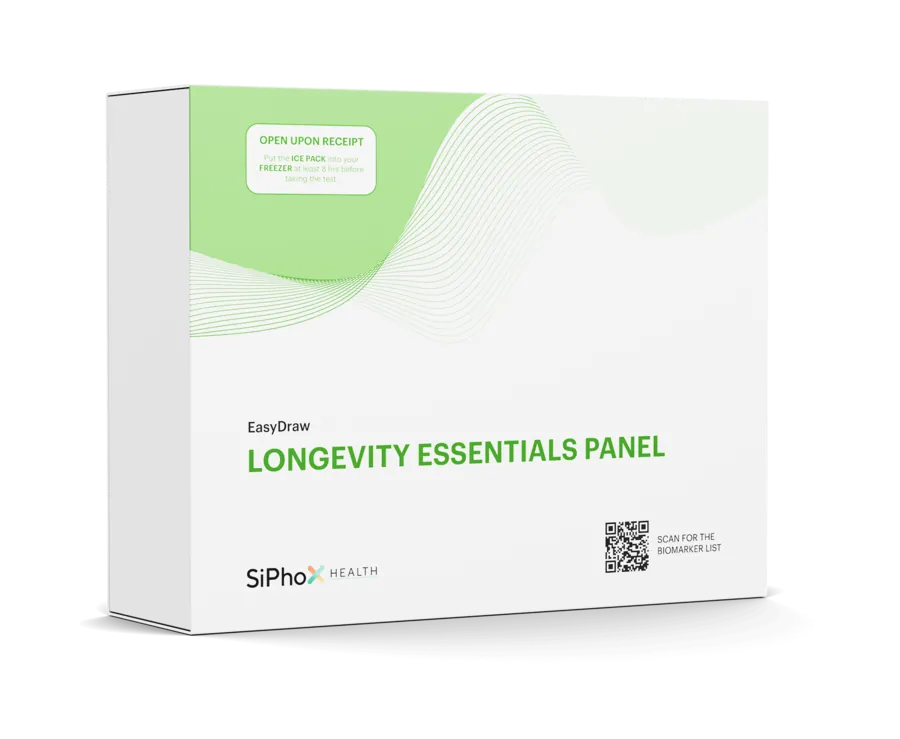
Longevity Essentials
The default panel: heart, metabolic, hormone and inflammation markers in one draw.
Check price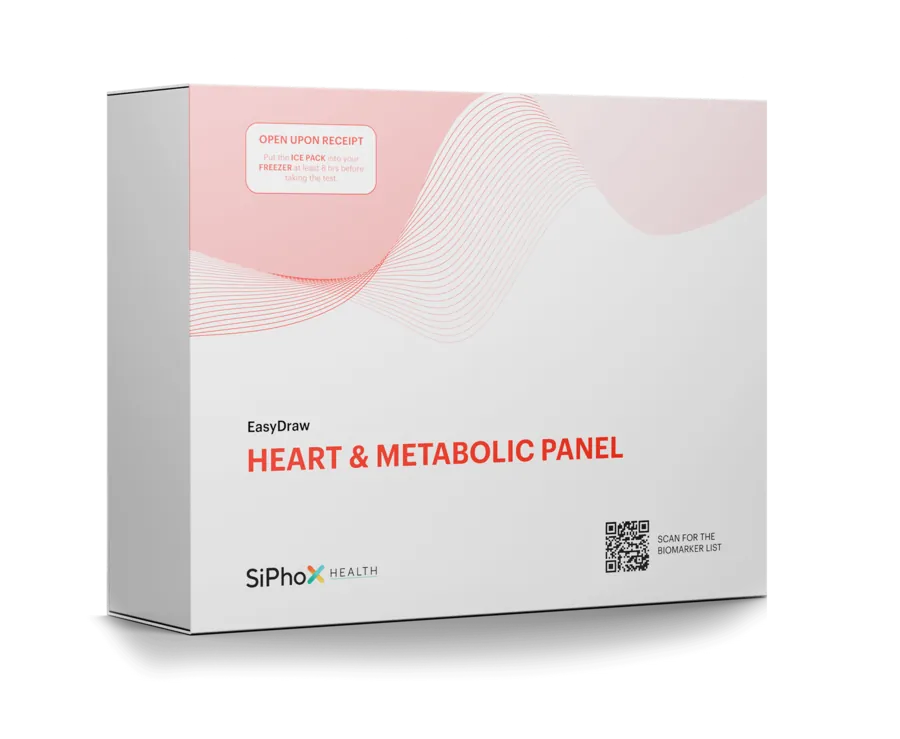
Heart & Metabolic
Lipids plus kidney and liver function: the panel for cardiovascular and metabolic risk.
Check price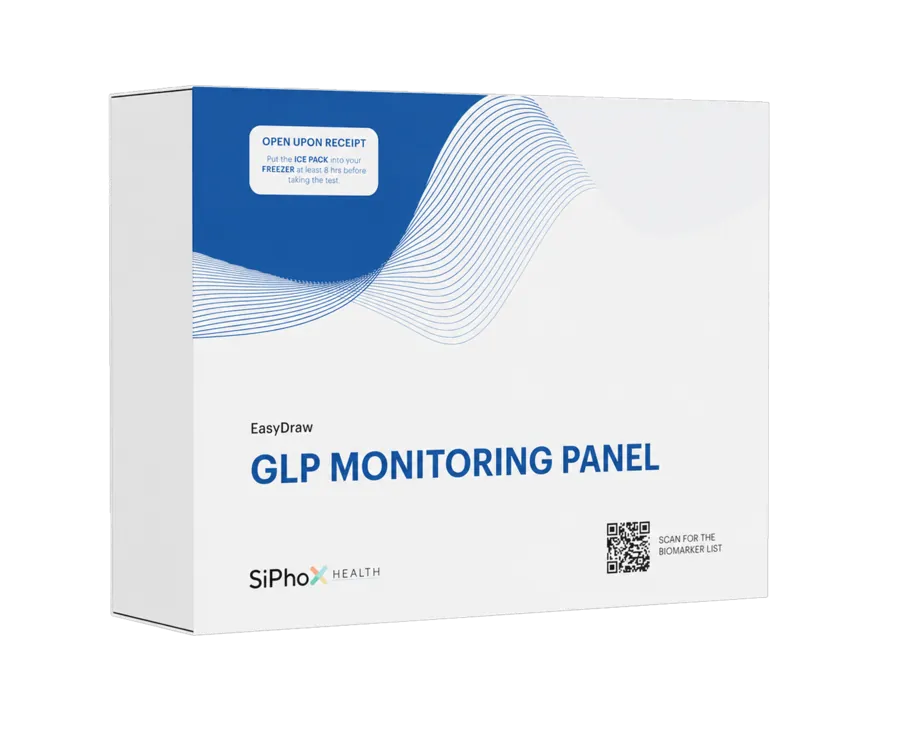
GLP Optimization
Built for people on GLP-1 medication: metabolic, liver, kidney, nutrient and iron markers.
Check price
Frequently asked questions
What is a normal HOMA-IR?
The model defines 1.0 as a healthy young adult. Under 2.0 is generally reassuring; published cut-offs for insulin resistance range from about 1.9 to 3.8, and 2.6 is a common clinical threshold. No official US range exists.
How do you calculate HOMA-IR?
Fasting glucose in mg/dL times fasting insulin in uIU/mL, divided by 405. With glucose in mmol/L, divide by 22.5 instead. Both samples must be fasting.
What is a normal fasting insulin level?
Labcorp's reference range is 2.6 to 24.9 uIU/mL. The range is wide: at a normal glucose of 90 mg/dL, an insulin of 24.9 gives a HOMA-IR of about 5.5.
Can I get HOMA-IR from an at-home test?
Only if the kit measures both fasting insulin and fasting glucose. SiPhox's current EasyDraw panels do not; they measure HbA1c, C-peptide and the TG:HDL ratio instead.
Is a HOMA-IR of 3 bad?
A value of 3 is above the common 2.6 threshold and suggests insulin resistance, although some population studies set the line as high as 3.8. Discuss it with your doctor along with HbA1c, triglycerides and waist size.
Sources
- Matthews DR et al. Homeostasis model assessment. Diabetologia 1985
- Wallace TM, Levy JC, Matthews DR. Use and abuse of HOMA modeling. Diabetes Care 2004
- Gayoso-Diz P et al. HOMA-IR cut-off values and the metabolic syndrome (EPIRCE). BMC Endocr Disord 2013
- Qu HQ et al. The definition of insulin resistance using HOMA-IR. PLoS One 2011
- Labcorp test 004333: Insulin (reference range)
- Labcorp test 001032: Glucose (reference range and fasting definition)
- MedlinePlus: Insulin in blood
- MedlinePlus: C-peptide test
- MedlinePlus: Hemoglobin A1C (HbA1c) test
- SiPhox Health panel comparison (checked 29 Sep 2026)
- SiPhox Health: Longevity Essentials EasyDraw panel and price
- SiPhox Health: Kidney, Liver and Lp(a) Panel