Quick answer: there is no separate A1C normal range by age: the American Diabetes Association (ADA) uses under 5.7% as normal, 5.7% to 6.4% as prediabetes and 6.5% or higher as diabetes for all adults. A1C still drifts up by about 0.1 percentage point per decade in people without diabetes (NHANES), and the ADA relaxes treatment goals for older adults with diabetes to under 7.0% to 7.5%, or under 8.0% for those in complex health.
Left end: average. Right end: 97.5th percentile. NHANES 2001 to 2004, 3,270 adults without diabetes (Pani et al., Diabetes Care 2008, Table 1). Prediabetes starts at 5.7%.

A1C levels by age: average and upper range
Researchers at Harvard and Framingham checked whether A1C rises with age in people who do not have diabetes, using two large data sets. It does, in both:
| Age | NHANES average | NHANES 97.5th percentile | Framingham average | Framingham 97.5th percentile |
|---|---|---|---|---|
| Under 40 | 5.20% | 5.7% | 4.97% | 5.99% |
| 40 to 44 | 5.28% | 5.8% | 5.08% | 6.28% |
| 45 to 49 | 5.37% | 6.0% | 5.19% | 6.61% |
| 50 to 54 | 5.40% | 6.0% | 5.20% | 6.26% |
| 55 to 59 | 5.44% | 6.0% | 5.28% | 6.51% |
| 60 to 64 | 5.46% | 6.1% | 5.40% | 6.83% |
| 65 to 69 | 5.50% | 6.1% | 5.46% | 6.56% |
| 70 and over | 5.51% | 6.2% | 5.50% | 6.61% |
Source: Pani et al., Diabetes Care 2008. A1C rose by 0.010 percentage points a year in NHANES and 0.012 to 0.014 in the Framingham Offspring Study, and the rise held even in Framingham participants with completely normal glucose tolerance. Fasting glucose rose about 8 mg/dL across the age range in both cohorts. These groups excluded diabetes but not prediabetes, which is why the 97.5th percentile crosses 5.7% from age 40.
The authors asked whether age-specific A1C criteria might be appropriate. The ADA has not adopted them: its 2026 cut-offs are the same at 30 and at 80.
A1C chart: diagnosis is the same at every age
| A1C | mmol/mol | Estimated average glucose | Category, all adults |
|---|---|---|---|
| Under 5.7% | Under 39 | Under 117 mg/dL | Normal |
| 5.7% to 6.4% | 39 to 47 | 117 to 137 mg/dL | Prediabetes |
| 6.5% or higher | 48 or higher | 140 mg/dL or higher | Diabetes (confirmed with a second test) |
Estimated average glucose uses the ADAG formula, 28.7 x A1C minus 46.7. For children and teens, the ADA notes the studies behind these cut-offs included only adults, but its guidance still accepts A1C, fasting glucose or a 2-hour glucose test to check youth for prediabetes and type 2 diabetes.
When to start checking, by age
- From 35: the ADA says screening should begin at age 35 for everyone, and repeat at least every 3 years if results are normal.
- Earlier: adults of any age with overweight or obesity plus a risk factor, such as a parent or sibling with diabetes or high blood pressure.
- Every year: anyone with prediabetes (A1C 5.7% or higher).
- 35 to 70 with overweight or obesity: the US Preventive Services Task Force recommends screening.
A1C goals by age if you have diabetes
Goals are where age matters. The ADA ties them to health status rather than a birthday, and loosens them when low blood sugar becomes the bigger risk:
For healthy older adults the goal is under 7.0% to 7.5%; the chart shows the upper end. In very complex or poor health, the ADA advises against relying on A1C.
| Group | A1C goal | ADA notes |
|---|---|---|
| Children and teens with diabetes | Under 7% | Under 6.5% encouraged in type 1 if reached without low blood sugar |
| Most nonpregnant adults | Under 7% | For people without severe or troublesome low blood sugar |
| Older adults, healthy (few illnesses, intact thinking and daily function) | Under 7.0% to 7.5% | With a glucose monitor: 70% or more of time in range |
| Older adults, complex or intermediate health (several illnesses, 2+ daily-living impairments or mild to moderate cognitive impairment) | Under 8.0% | Avoiding low blood sugar comes first |
| Older adults, very complex or poor health | No A1C target | Avoid low blood sugar and symptomatic high blood sugar |
Worked examples
A 67-year-old without diabetes and an A1C of 5.9% (average glucose about 123 mg/dL). That is prediabetes by the ADA definition at any age, even though it sits below the NHANES 97.5th percentile for 65 to 69 (6.1%). The ADA advice is the same as at 40: repeat yearly, and work on weight and activity. See our prediabetes blood test guide.
A 38-year-old with 5.8% (about 120 mg/dL). Only just into prediabetes, but above the 97.5th percentile for people under 40 without diabetes (5.7%), so it is unusual for the age and worth discussing with a doctor.
An 80-year-old with type 2 diabetes, mild cognitive impairment and an A1C of 7.7% (about 174 mg/dL). Inside the under-8.0% goal the ADA suggests for complex health. Pushing it down to 7% could raise the risk of low blood sugar and falls; any change is a decision for their doctor.
When A1C misleads
A1C depends on red blood cells, so iron deficiency, other anemias, kidney disease, hemoglobin variants, recent blood loss or transfusion and pregnancy can push it off. If yours does not match your glucose readings, see the main HbA1c guide and consider checking ferritin.
How to test A1C at home
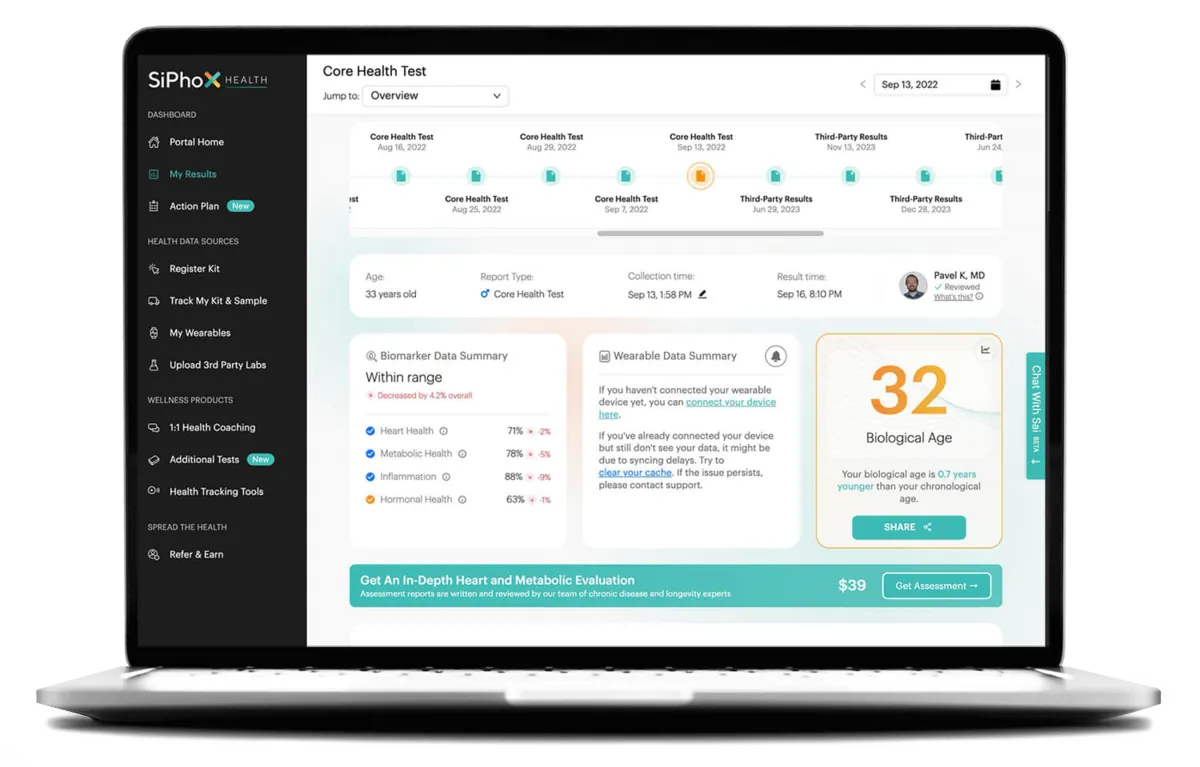
SiPhox Health measures HbA1c on four panels. None of them measures glucose or fasting insulin; all four include C-peptide, a marker of how much insulin your pancreas makes.
| SiPhox panel | Blood sugar markers | Also includes | Per test with shipping |
|---|---|---|---|
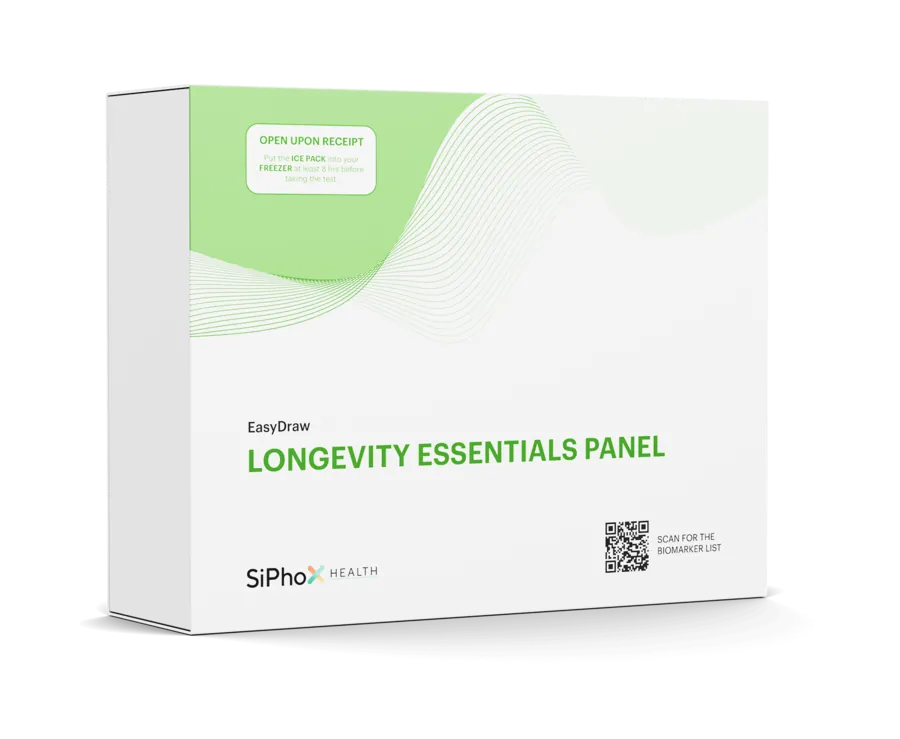
| Longevity Essentials | HbA1c, estimated average glucose, C-peptide | ApoB, Lp(a), lipids, hormones, vitamin D | $149 |
| Heart & Metabolic | HbA1c, C-peptide | Lipids, kidney and liver markers | $149 |
| GLP Optimization | HbA1c, estimated average glucose, C-peptide | Liver, kidney, iron, B12 | $224 |
| Ultimate 360 | HbA1c, estimated average glucose, C-peptide | 55+ other markers | $274 |
| If you want to | Test | Choose |
|---|---|---|
| Screen from 35, or recheck a borderline result | HbA1c with lipids | Longevity Essentials ($124 + $25) |
| Watch prediabetes along with kidneys and liver | HbA1c, eGFR, ALT | Heart & Metabolic ($124 + $25) |
| Track A1C on a GLP-1 medicine | HbA1c, C-peptide, nutrients | GLP Optimization ($199 + $25) |
| Get a diagnosis | Lab A1C or fasting glucose, repeated | Your doctor |
Fingertip meters and other mail-in kits are compared in our at-home A1C test guide.
A note on home samples: SiPhox's partner lab tests capillary blood collected from the upper arm. SiPhox says its results show a 95% to 99% correlation with venous draws in its own quarterly comparisons against Labcorp and Quest, but it has not published a study of the EasyDraw device, and results come without an included doctor review. If a result would change a treatment decision, confirm it with a venous test through your doctor.
Longevity Essentials
The default panel: heart, metabolic, hormone and inflammation markers in one draw.
Check price
Heart & Metabolic
Lipids plus kidney and liver function: the panel for cardiovascular and metabolic risk.
Check price
GLP Optimization
Built for people on GLP-1 medication: metabolic, liver, kidney, nutrient and iron markers.
Check price
Frequently asked questions
What is a normal A1C for a 60-year-old?
Under 5.7%, the same as at any adult age. In NHANES, adults without diabetes aged 60 to 64 averaged 5.46%, with the 97.5th percentile at 6.1%.
What is a normal A1C for a 70-year-old?
Under 5.7% is normal. The average for adults 70 and over without diabetes was 5.51% in NHANES. For a 70-year-old who has diabetes, the ADA goal is under 7.0% to 7.5% in good health, or under 8.0% in complex health.
Does A1C go up with age?
Yes, slowly: by about 0.1 percentage point per decade in NHANES, even in people with normal glucose tolerance (Pani et al., 2008). The diagnostic cut-offs do not change.
What A1C goal is right for older adults with diabetes?
The ADA suggests under 7.0% to 7.5% for healthy older adults, under 8.0% for those with several illnesses or cognitive or functional limits, and no fixed A1C target in very poor health, where avoiding low blood sugar comes first.
At what age should I start checking A1C?
At 35 for everyone, per the ADA, and earlier if you have overweight or obesity plus another risk factor. Repeat at least every 3 years if normal, and yearly with prediabetes.
Sources
- American Diabetes Association. 2. Diagnosis and classification of diabetes: Standards of Care in Diabetes 2026. Diabetes Care 2026
- American Diabetes Association. 6. Glycemic goals, hypoglycemia and hyperglycemic crises: Standards of Care in Diabetes 2026
- American Diabetes Association. 13. Older adults: Standards of Care in Diabetes 2026. Diabetes Care 2026
- American Diabetes Association. 14. Children and adolescents: Standards of Care in Diabetes 2026. Diabetes Care 2026
- Pani LN et al. Effect of aging on A1C levels in individuals without diabetes: Framingham Offspring Study and NHANES 2001-2004. Diabetes Care 2008
- Nathan DM et al. Translating the A1C assay into estimated average glucose values. Diabetes Care 2008
- US Preventive Services Task Force: Prediabetes and type 2 diabetes screening (2021)
- CDC: A1C test for diabetes and prediabetes
- SiPhox Health: panel comparison (checked 29 Sep 2026)
- SiPhox Health: Longevity Essentials panel
- SiPhox Health: Heart & Metabolic panel
- SiPhox Health: GLP Optimization panel